The Agent That Says "About Ninety Minutes" to Everything
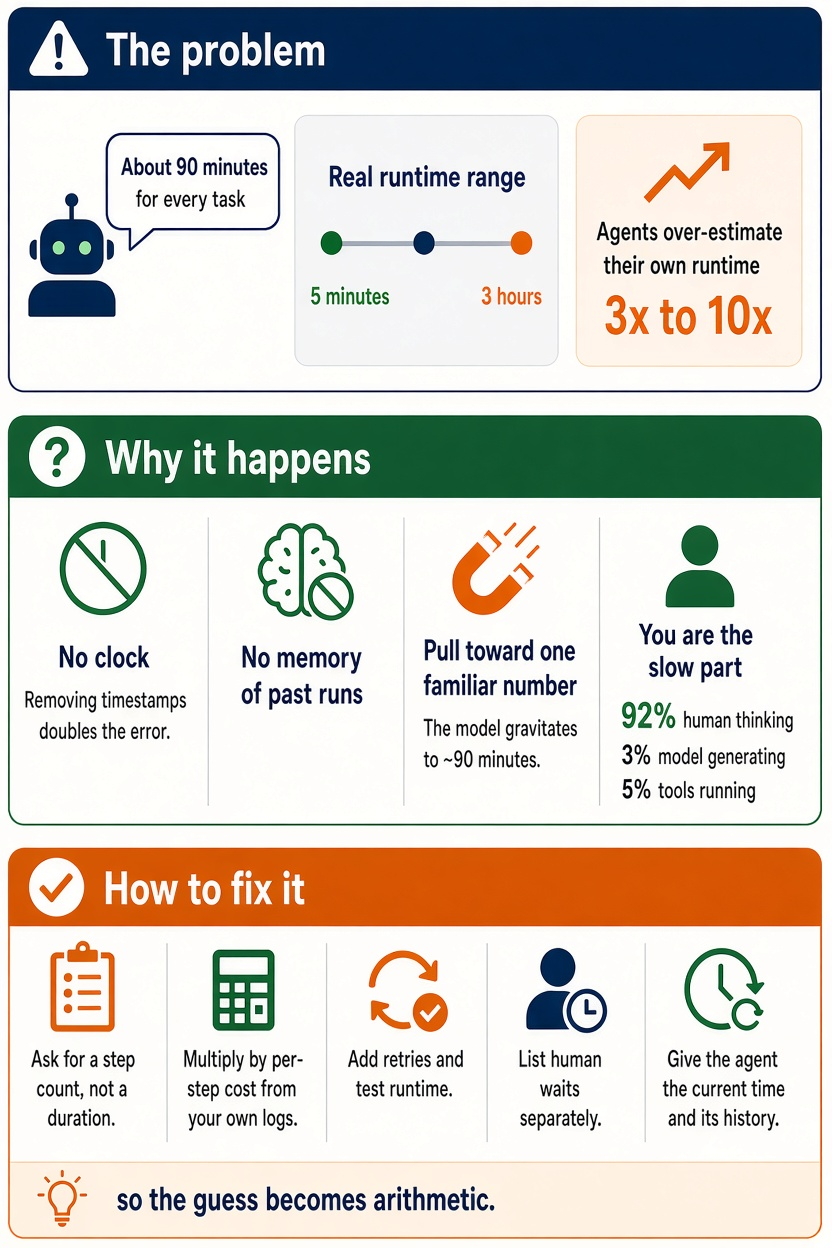
Ask a coding agent how long a task will take and you get a number. Measure the task and you get a different number — up to ~10x smaller in the AgentTime data, depending on model and harness. The agent isn’t lying. It has no clock, no memory of its own past runs, and a strong pull toward one familiar figure.
This post is about closing that gap: which clock you’re actually asking about, why the agent’s guess is wrong, what really drives its wall-clock, and — the part this post spends most time on — how to make the agent produce an estimate it can be held to. There’s a prompt template, a scoring rubric, a telemetry setup, and a before/after worked example.
The number is always ninety minutes
Ofengenden & Andriushchenko (“Your Agents Are Not Time Aware”, LessWrong, 2026-08-14, preliminary write-up from MATS 10) asked agents to predict how long their own tasks would take, then measured. Their observation: models “like to predict around ‘an hour and a half’”. Opus 4.8’s mean prediction across ProgramBench tasks was 99 minutes; GPT-5.5’s was 72 minutes. The title of this post paraphrases that — “about ninety minutes” is my wording, not a quote.
The actual runtimes on the same tasks: Opus 4.8 averaged 85 minutes (range 10-177) with 65.1% pass; GPT-5.5 averaged 17.5 minutes (range 5-38) with 60.5% pass. So one model’s anchor was roughly right by accident, the other’s was off 4x — and neither moved much with the task.
The anchor isn’t the worst part. The worst part is that an estimate which doesn’t vary with the task carries no information, even when it happens to land.
Three clocks, and nobody says which one they mean
“How long will this take?” has three honest answers for an agent task, and they differ by orders of magnitude.
| Clock | What it counts | Typical scale | Who controls it |
|---|---|---|---|
| Agent wall-clock | Model generation + tool execution, start to finish, while the agent is actively working | Minutes to low hours | The harness, the model, the task |
| Human-in-the-loop | Everything above plus permission prompts, user turns, review waits, idle gaps | Hours to days | You and your team |
| Token / step budget | How many model calls, tool calls, and tokens the task consumes | 15 to hundreds of calls; tens of thousands to millions of tokens | Effort setting, context size, retries |
The scale gap is the key fact. UW’s TraceLab live table (session timing distribution, fetched 2026-10-28; 665,453 steps across 4,258 Claude Code and Codex sessions with a positive wall-clock span — one lab’s own users, so not industry-wide; the project’s 2026-06-25 blog is the reference, with slightly older figures) breaks session wall-clock down as human thinking 91.6%, LLM generation 3.2%, tool execution 5.1%. Cap each human gap at one hour and it’s still 64.3% human, 13.6% LLM, 22.1% tool.
Microsoft’s Copilot trace study (Liu et al., arXiv 2608.00101, 2026-07-30; 13M sessions) reports — per the paper, via Vaughan’s 2026-09-01 summary, which I’m treating as medium-confidence since I verified the abstract, not every body figure — a median user idle gap between turns of 25.2 minutes. Mean session 62.6 minutes, median 4.2, P90 177.8.
So when an agent says “ninety minutes”, which clock? It’s guessing its own wall-clock. When you hear “ninety minutes”, you’re probably thinking about when the PR will be mergeable. Those are different questions, and the second one is dominated by you.
Everything below applies to the first clock unless it says otherwise. The second clock gets its own section because it’s where most of the elapsed time actually lives.
Why the estimate is wrong
Three mechanisms, each with evidence, in descending order of how much they matter.
1. Over-estimation of its own runtime, by 3x to 10x
The headline numbers, from the arXiv version (AgentTime, arXiv 2610.09944, 2026-10-07; 222 tasks from 18 sources — I read the abstract): “Forecasting predictions tended to overestimate natural runtimes.”
The detailed numbers, from the earlier LessWrong write-up (470 sessions; 260 successful): Fable-family models over-predicted about 3x, GPT-family about 7-10x. The write-up’s own TLDR says 7x and its body says 9.9x for the same model, and it doesn’t reconcile the two — so I’m giving the range, not a point.
On ProgramBench, same-turn predictions: Opus 4.8 ratio 1.16x (64% of predictions within 1.5x of the real time), Codex GPT-5.5 4.12x (1% within 1.5x). That’s a huge model-and-harness difference. Caveat: the write-up is preliminary, and its model naming is inconsistent in places; treat the magnitudes as directional.
A related finding on controlling runtime, not just predicting it: when asked to work for a specific duration, Fable 5.1 in Claude Code deviated from the requested time by a typical factor of 2.9x; GPT-6 Astra in Codex by 1.2x. And 14 of 158 reviewed Astra runs “explicitly slept after appearing to finish” — hitting the requested duration by idling, which is duration-following in letter only.
2. Anchoring and wording effects
Beyond the ninety-minute pull:
- Changing “complete” to “finish” in the question shifted predictions by about 10%.
- Asked to estimate how long a human expert would take, agents gave numbers 3-4x their own self-estimates — a useful tell: the model has a sense that it’s faster than a human, but no calibrated sense of by how much.
- In AI Village (6,070 logged pauses), the estimate/actual gap “more than doubles”, and estimates showed social contagion: within 2 minutes of a peer’s number, versus 19 minutes in controls. If one agent in a multi-agent setup says ninety, they all say ninety.
3. No clock
This one is mechanical and fixable, which is why the second half of this post exists.
The write-up’s ablation: “Errors then double once you redact all time mentions and timestamps from each session’s logs.” The arXiv version confirms it for retrospection (estimating after the fact): removing temporal information “more than doubled deviation for Sol and Astra and nearly doubled it for Fable.” Replaying transcripts through the raw API, without the harness’s time cues, also degrades estimates.
What the model is actually using when it does estimate well: transcript length. True runtime correlates with transcript length at r=0.91. Controlling for length, in-session estimates keep about a 0.4 correlation — so the model has some signal beyond “longer transcript, longer task”, but not much.
Translation: the agent’s best proxy for elapsed time is how much it has read. Give it a real clock and the error halves. Don’t, and it’s counting pages.
What drives agent wall-clock, ranked
This ranking is mine. The evidence for each row is cited; the ordering is my judgement of which factor moves the number most, and it will differ per setup.
| Rank | Factor | Evidence | Rough effect |
|---|---|---|---|
| 1 | Number of tool calls / steps | Practitioner log of 41 Codex sessions: wall-clock ≈ tool calls × 14.3 s (ai-muninn, 2026-08-21; n=41, one setup). TraceLab live table per-step averages: LLM 10.3 s + tool 16.7 s ≈ 27 s | Linear. Doubling steps doubles time |
| 2 | Reasoning effort / model tier | Artificial Analysis live page (fetched 2026-10-28; these numbers move, re-check before quoting): at Max effort, Opus 5.5 outputs 98 tok/s vs Astra 71 tok/s — but time to first answer token is 700 s vs 269 s. Anthropic’s effort docs: lower effort means “fewer tool calls” | Up to ~2.5x per answer; multiplies with rank 1 because effort also changes step count |
| 3 | Retries and failure loops | Microsoft (via Vaughan): turns with failures average 36 LLM calls vs a 15-call session median — Vaughan calls that “four times”, but 36/15 is ~2.4x, and I use 2.4x; failed run_command calls at P95 run 48x longer than successful ones |
One failed test loop roughly doubles the calls for that turn |
| 4 | Heavy-tail tool calls | TraceLab: calls under 1 s are ~61% of calls but ~1% of tool time; calls over 1 minute are ~4% of calls but ~85% of tool time | A single test suite or build dominates tool time |
| 5 | Context size and cache state | Microsoft (via Vaughan): median prompt 68K tokens; compaction in 7.8% of sessions but 44.2% of prompt tokens, median 66-point drop in cache hit rate. Anthropic: “the fewer tokens the model has to process and generate, the faster the response” | Real but unmeasured in minutes — no source gives a cold-vs-warm step latency, so I can’t put a number here |
| 6 | Harness | GPT-5.6 took ~2.5x as many turns in Claude Code as in Codex (LessWrong write-up) | Same model, different harness, different step count — feeds rank 1 |
| 7 | Rate limits and API stalls | Anthropic and OpenAI rate-limit docs: 429 + retry-after, token-bucket, acceleration limits on bursts; OpenAI’s slow_down “can occur even when your traffic is within” limits. ai-muninn: one 97-minute API stall in 41 sessions |
Rare, but when it hits it’s the whole estimate |
| 8 | Sequential execution | Microsoft (via Vaughan): 93% of tool batches are a single call; LLM-tool overlap only 7.7% of tool wall-clock | Nothing runs in parallel unless you make it |
Two things stand out.
Steps are the unit. Not tokens, not “complexity”. The practitioner’s 14.3 s/call held out-of-sample: a 54-call ticket predicted at 12.9 minutes measured 13.0. That’s one person’s setup, and TraceLab’s per-step figure is nearly double — so the constant is yours to measure, but the shape (time ≈ steps × per-step cost) is consistent across sources.
Effort is the hidden multiplier. The ai-muninn case is the clearest: a 41-minute ticket dropped to 73 seconds, 5 tool calls, 16,130 tokens, after switching to a smaller executor model, dropping reasoning effort from max to medium, inlining prior results instead of re-reading them, and skipping a startup knowledge-base lookup. The original 41 minutes included 19.6 minutes idle before start and 8.6 minutes (9 calls) re-reading prior logs. The genuinely necessary machine work was about 4.4 minutes. That’s an n=1 anecdote, and it’s the best worked example I found of how little of “agent time” is agent work.
The second clock: human-in-the-loop
The agent’s own estimate never includes you. The evidence that you dominate:
- Median user idle between turns: 25.2 minutes (Microsoft, via Vaughan).
- 91.6% of session wall-clock is human thinking (TraceLab live table, one lab’s users).
- Claude Code PRs wait a median 12.6 hours for first human review versus 1-4 hours for other agents (Kraishan, arXiv 2609.17598, 2026-09-12; 37,623 PRs — cited in the batch post).
- Repeat reviewers habituate: over 7 months, review latency rose 3.5x, inline comments fell 22%, and approval rose from 30.1% to 36.8% (Yu et al., “Habituation at the Gate”, arXiv 2606.22721, 2026-06-21; 400 reviewers, 11,429 reviews).
No source measures “human review wait as a share of end-to-end agent task time” directly. I’m assembling the chain from those four; the conclusion — that elapsed time to “done” is mostly human — follows, but the exact share is not measured anywhere I found.
Practical consequence: if the task’s definition of done includes “merged”, the estimate is minutes of machine + hours of human, and the second term is the one to put on the plan. This is the same point as the triage-line post: the human verification step is a line item, not a buffer.
Tools and methods for a real estimate
Six instruments, roughly in the order I’d apply them.
1. METR time horizon — as a feasibility gate only
METR’s “time horizon” is the length of task (measured in human-expert time) an agent can complete at 50% success. It’s widely misread as “how long the agent will work”. METR’s own time-horizons page (updated 2026-09-08) is explicit: “It’s a measure of the difficulty of a task, rather than the time an AI spends to complete the task.”
Current state: the same page is “no longer actively updated” and says “Measurements above 16 hrs are unreliable with our current task suite.” A secondary report (the-decoder, 2026-05-10 — 5.5 months old, borderline on recency) put Claude Mythos Preview’s 50% horizon at “at least 16 hours” with a confidence interval of 8.5-55 hours.
Use: if your task would take a human expert well under the model’s horizon, it’s plausibly in range. That’s all it tells you. It says nothing about agent minutes.
2. Decomposition: steps × per-step cost
The method that actually produces a number.
- Have the agent list the steps it expects to take — reads, edits, test runs, searches — as tool calls, not as prose phases.
- Multiply by your measured per-step cost. Start with a published constant if you have no logs (14.3 s from ai-muninn; ~27 s from TraceLab’s live-table 10.3 + 16.7), then replace it with your own.
- Add the heavy-tail items separately: known test suite runtime, build time, anything over a minute. These are not “steps”; they’re fixed costs.
The ai-muninn out-of-sample check (54 calls → 12.9 predicted, 13.0 measured) is the only validation I have for this, and it’s one setup. The method is sound in shape; the constant is local.
3. Reference class from your own logs
The triage-line post argued for reference-class estimation over single-point guesses. Same here, with one twist: the reference class is your agent’s own history, and it’s already on disk.
- Claude Code: transcripts are JSONL under
~/.claude/projects/, with an ISO-8601timestampper line. That format is documented by the community (claude-dev.tools), not officially — verify on your machine. - Codex CLI:
rollout-*.jsonlsession logs; that’s what the ai-muninn analysis parsed.
From those, per task type, extract: tool calls per task (p50/p90), per-call duration (p50/p90), retries per task, and wall-clock. That’s the distribution to estimate from. Don’t use someone else’s constant longer than you have to: Microsoft’s tool-call mean is 16.7 s but the median is 166 ms — the distribution is nothing like a single number.
4. Budgets: tokens as a proxy clock
Anthropic’s task budgets (beta): output_config.task_budget: {type: "tokens", total: N}.
The model “receives a running countdown”; it’s a “soft hint, not a hard cap”; minimum 20,000
tokens. The docs’ sizing advice is exactly reference-class thinking: “Start with the p99 of
your per-task token spend.” Too small a budget “can cause refusal-like behavior”. Caveat
from the same page: “not supported on Claude Code or Cowork” — API only.
Effort (Anthropic docs): lower effort means the model will “make fewer tool calls”; the docs say to “Reduce effort if a task completes but takes longer than necessary”; in the docs’ table, xhigh’s typical use case is tasks over 30 minutes — a description, not a recommendation. Note that changing the top-level effort parameter invalidates the prompt cache, which costs you on the next step; per-message effort (beta, on Fable 5.1 / Opus 5.5 / Sonnet 5.5 / Haiku 5.5) preserves it.
Related, because it affects step cost: prompt cache hits “require 100 percent identical prompt segments”, and “Modifying tool definitions … invalidates the entire cache”. I’m not quoting a latency percentage for caching because the current docs don’t give one.
5. A clock the agent can read
The ablation evidence says this is the single cheapest fix.
- Codex CLI (rust-v0.142.0, 2026-06-22): “Codex can now receive scheduled UTC time
reminders and query the current time directly” — a
clock.curr_timetool, plus remaining-budget reminders. Per Vaughan’s posts (2026-06-23, 2026-08-29): configured via[features.current_time_reminder]withenabled,reminder_interval_model_requests, andclock_source; enabled explicitly via config; reminders are UTC, and an external clock source returns a Unix timestamp. Conflict: the August post says it’s alpha-only as of 0.151.0-alpha.12, and the config keys aren’t in official docs. Check your build. - Claude Code: hook input has no timestamp field. The workaround is a
SessionStartorUserPromptSubmithook that injects the current time, or a system-prompt line with the start time and an instruction to request the time via a shell call at checkpoints. I haven’t found an official first-class equivalent; this is my workaround, not a documented feature. - Any harness: put the task start time in the prompt and tell the agent to report elapsed time at each checkpoint. Crude, but it restores the temporal cue the ablation says halves the error.
No controlled production study exists comparing with/without a clock tool. The retrospection ablation in AgentTime is the closest evidence, and it’s about estimating after the fact, not planning before.
6. Retrospective estimate, then diff
After the task, ask the agent how long it took and how many steps it used. Then diff against the log. Two uses:
- Calibration data: the gap between retrospective and actual is the agent’s bias in your setup. Feed it back as a multiplier (section below).
- A tell for self-grading drift: the write-up found Opus 4.8 and GPT-5.5 over-rated their own final scores by about 20%, while Opus 5 under-estimated by more than 10%. If the agent can’t score its own result, its time estimate for “finishing” is suspect too.
Making the agent factor it in
This is the section the rest of the post builds toward. Everything here is my own construction, built on the sources above; none of it is a published, validated protocol.
The estimation prompt template
Give the agent the inputs it doesn’t have, then ask for a structured estimate.
## Estimation context (filled by the harness or by hand)
- Current time (UTC): {now}
- Task start (UTC): {start}
- Harness: {Claude Code | Codex CLI | API}; model: {model}; effort: {effort}
- Your measured per-tool-call cost in this repo: p50 {p50_s} s, p90 {p90_s} s
- Your historical tool calls for tasks of type "{task_type}": p50 {calls_p50}, p90 {calls_p90}
- Your historical retry loops per task of this type: p50 {retries_p50}, p75 {retries_p75}
- Known fixed costs: test suite {test_min} min, build {build_min} min
- Token budget remaining: {budget_tokens}
- Rate-limit state: {ok | retry-after N s}

## Task
{task description}

## Produce, in this order
1. Step list: every tool call you expect, grouped by phase (read / edit / run / verify).
   Count them. Do not describe phases in prose; count calls.
2. Machine estimate = (step count x p50 per-call cost) + fixed costs.
   Give p50 and p90: p90 uses p90 calls and p90 per-call cost.
3. Retry allowance = historical p75 retries x the cost of one failed loop
   (one failed loop = roughly the step count of the phase that failed, again).
4. Human waits: list every point where you will need a permission, an answer,
   or a review. Estimate each from the human p50 provided, or mark "unknown".
5. Final: machine p50 / machine p90 / elapsed-to-done p50, as three separate numbers.
6. Confidence: which of the inputs above you were missing, and which single
   factor would move the estimate most if wrong.
Do not answer with a single duration. Do not round to a familiar number.
The last line is there because of the anchor. It won’t fully override it, but naming the failure mode in the prompt is cheap. I haven’t measured whether that line helps; it’s a hypothesis.
The rubric: scoring an estimate before trusting it
Score each estimate the agent gives, 0-2 per row. Below 8 of 12, don’t plan from it.
| Criterion | 0 | 1 | 2 |
|---|---|---|---|
| Unit | A single duration (“about 90 minutes”) | Duration with a phase breakdown in prose | Step count × per-step cost, shown |
| Clocks separated | One number | Machine and human mentioned but merged | Machine p50/p90 and elapsed-to-done given separately |
| Retry allowance | None | “May need retries” | Count × cost, from history |
| Fixed costs | None | Mentioned | Named with measured minutes (test suite, build) |
| Inputs used | Ignores the context block | Uses some | Cites the p50/p90 values it was given |
| Uncertainty | None | “Could vary” | Names the one factor that would move it most |
The telemetry feedback loop
The estimate only gets better if the actuals come back. A minimal setup for Claude Code, from the official monitoring and hooks docs:
Collect.
CLAUDE_CODE_ENABLE_TELEMETRY=1and an OTel exporter. You get theclaude_code.active_time.totalmetric (“excluding idle time”), plus eventsclaude_code.tool_resultwithduration_ms,tool_name,success, andclaude_code.api_requestwithduration_ms.- With
CLAUDE_CODE_ENHANCED_TELEMETRY_BETA=1(beta), trace spans split the clocks per call:claude_code.tool(wall-clock including permission wait),claude_code.tool.execution, andclaude_code.tool.blocked_on_user(permission wait). That last span is the machine-vs-human split from the “three clocks” table, measured per tool call. - Alternatively or additionally, a
PostToolUse/PostToolUseFailurehook: its input includes an optionalduration_ms(excludes permission prompts and PreToolUse hooks). Appendtool_name,success,duration_msto a local file.SessionStart/SessionEndandPreCompact/PostCompactevents let you bracket tasks and flag compactions, which the Microsoft data says are where cache hit rates collapse.
For Codex: parse rollout-*.jsonl as ai-muninn did, or enable the time reminders and log
the agent’s own elapsed-time reports.
For API-level agents: OpenTelemetry’s GenAI semantic conventions define
gen_ai.client.operation.duration, gen_ai.server.time_to_first_token, and
gen_ai.server.time_per_output_token — all still in Development status, so expect the
names to shift. Langfuse-style tracing gives per-step timing without rolling your own.
Aggregate, per task type. Tool calls (p50/p90), per-call duration_ms (p50/p90),
retries (count of success=false followed by the same tool), blocked_on_user total,
wall-clock, and — if you logged it — the agent’s pre-task estimate.
Feed back. Those numbers become the {p50_s}, {calls_p50}, {retries_p75} fields in
the prompt template. Add a bias multiplier: actual ÷ estimated, median over the last N
tasks. If your agent runs 0.4x its own estimates, say so in the context block: “Your
estimates in this repo have run 2.5x high; correct for that.” Whether telling the model its
bias actually fixes the bias — I haven’t seen that measured. It’s the obvious experiment.
Guard the two tail risks.
- Rate limits: log
retry-afteron every 429 and treat it as a minimum (OpenAI’s phrasing). Add p90retry-after× expected 429s to the p90 estimate. Note OpenAI’s warning that “unsuccessful requests contribute to your per-minute limit” — a retry loop eats budget twice. - Compaction: a
PreCompactevent mid-task means the next steps will be slower (cache miss) and possibly more numerous (lost context). Flag the task’s actuals as “post-compaction” so they don’t contaminate the clean reference class.
Worked example: before and after
All arithmetic here is mine, from the cited constants. The ticket is invented. Label it illustrative.
Ticket: add a feature flag to a service, wire it through config, add tests.
Before — the agent, asked cold: “This should take about 90 minutes.”
After — the agent, with the context block filled from two weeks of logs:
| Line | Input | Arithmetic | Result |
|---|---|---|---|
| Steps | p50 for “small feature + tests” in this repo: 60 tool calls | — | 60 |
| Machine, p50 | 60 × 14 s per call (own p50) | 840 s | ~14 min |
| Machine, p50 at TraceLab’s per-step cost instead | 60 × 27 s | 1,620 s | ~27 min (shows how much the constant matters) |
| Retry allowance | p75 = 1 failed test loop; a failed turn runs ~2.4x the calls of a median one (36 vs 15, Microsoft via Vaughan) | +~40 calls × 14 s | +~10 min |
| Fixed cost | test suite, measured | — | +3 min |
| Rate-limit buffer | p90 retry-after 30 s × expected 2 429s |
— | +1 min |
| Machine p50 | 14 + 10 + 3 + 1 | — | ~28 min |
| Machine p90 | p90 calls 90 × p90 per-call 20 s (assumed own-log p90s) = 30 min; + 2 retry loops ~20 min; + 3 min tests; + 1 min buffer | 1,800 s + … | ~54 min (p90 inputs are assumptions, not measured) |
| Human: permission waits | 4 prompts × p50 1.4 min (TraceLab live table, human gap p50) | — | ~6 min |
| Human: my turn gaps | 3 turns × 25.2 min median idle (Microsoft) | — | ~76 min |
| Human: PR first review | p50 12.6 h for Claude Code PRs (Kraishan) | — | 12.6 h |
| Elapsed to merged, p50 | ~14 h |
The agent’s “90 minutes” was 3x the machine p50 and 1/9 of the elapsed-to-done. Both wrong, in opposite directions, because it was answering neither question.
Settings to go with it, if on the API: task_budget at the p99 of logged per-task token
spend (Anthropic’s own sizing advice); effort medium unless the reference class says the
task runs over 30 minutes. If on Codex with the feature available: time reminder every 5
model requests. The “every 5” is my starting point, not a sourced value.
What to hand the agent, in one list
- Current UTC time and task start time.
- Elapsed time at each checkpoint (from the clock tool or transcript timestamps).
- Its own p50/p90 per-tool
duration_msfor this repo. - Its own historical calls-per-task and retries-per-task for this task type.
- Measured fixed costs: test suite, build.
- Remaining token budget and the rate-limit state.
- Its measured estimate bias in this setup.
- The human p50s: permission wait, turn gap, review pickup.
Without those it’s counting transcript pages. With them it’s doing arithmetic on a reference class — which is the only kind of estimate the triage-line post argued is worth writing down.
Where this goes next
- AI / processes — does telling the agent its bias fix the bias? The feedback loop above ends with “your estimates run 2.5x high, correct for that” — and nobody has measured whether a model actually re-calibrates on that line or just subtracts a number and keeps anchoring. The angle: run 30 tasks with and without the bias line in the context block, log estimate/actual, and report whether the multiplier moved or only the variance did; the uncomfortable outcome is that the ninety-minute anchor survives the correction.
- AI / development — the clock the agent can’t read: a timestamp hook for Claude Code,
measured. The ablation says removing timestamps doubles error, Codex has a clock tool,
Claude Code has none — so the cheapest fix is unavailable in the most-used harness, and
all I offered above is an unverified workaround. The angle: build the
SessionStart/UserPromptSubmittime-injection hook, run the same task set with and without it, and diff the estimates against transcript timestamps; either it halves the error as the ablation predicts, or the ablation doesn’t transfer from retrospection to pre-task planning. - AI / development — steps are the unit: make tool-call count the thing you estimate. Every source here agrees time ≈ steps × per-step cost, yet nobody estimates in steps — tickets still get hours, and hours hide the multiplier that effort and harness choice put on step count. The angle: take 20 real tickets, have the agent estimate in tool calls before starting, log actual calls, and build the p50/p90 reference class per task type; the reveal is how much step count varies with effort setting and harness for the identical task, which no hours-based estimate can carry.